"semi-transparency is not supported on this device" in R
If you’ve ever tried to make an R plot with transparency:
library("ggplot2")
ggplot(iris, aes(x = factor(Species), y = Sepal.Length, fill = Species)) +
  geom_boxplot(alpha = 0.4)
But had the plot come out like this:
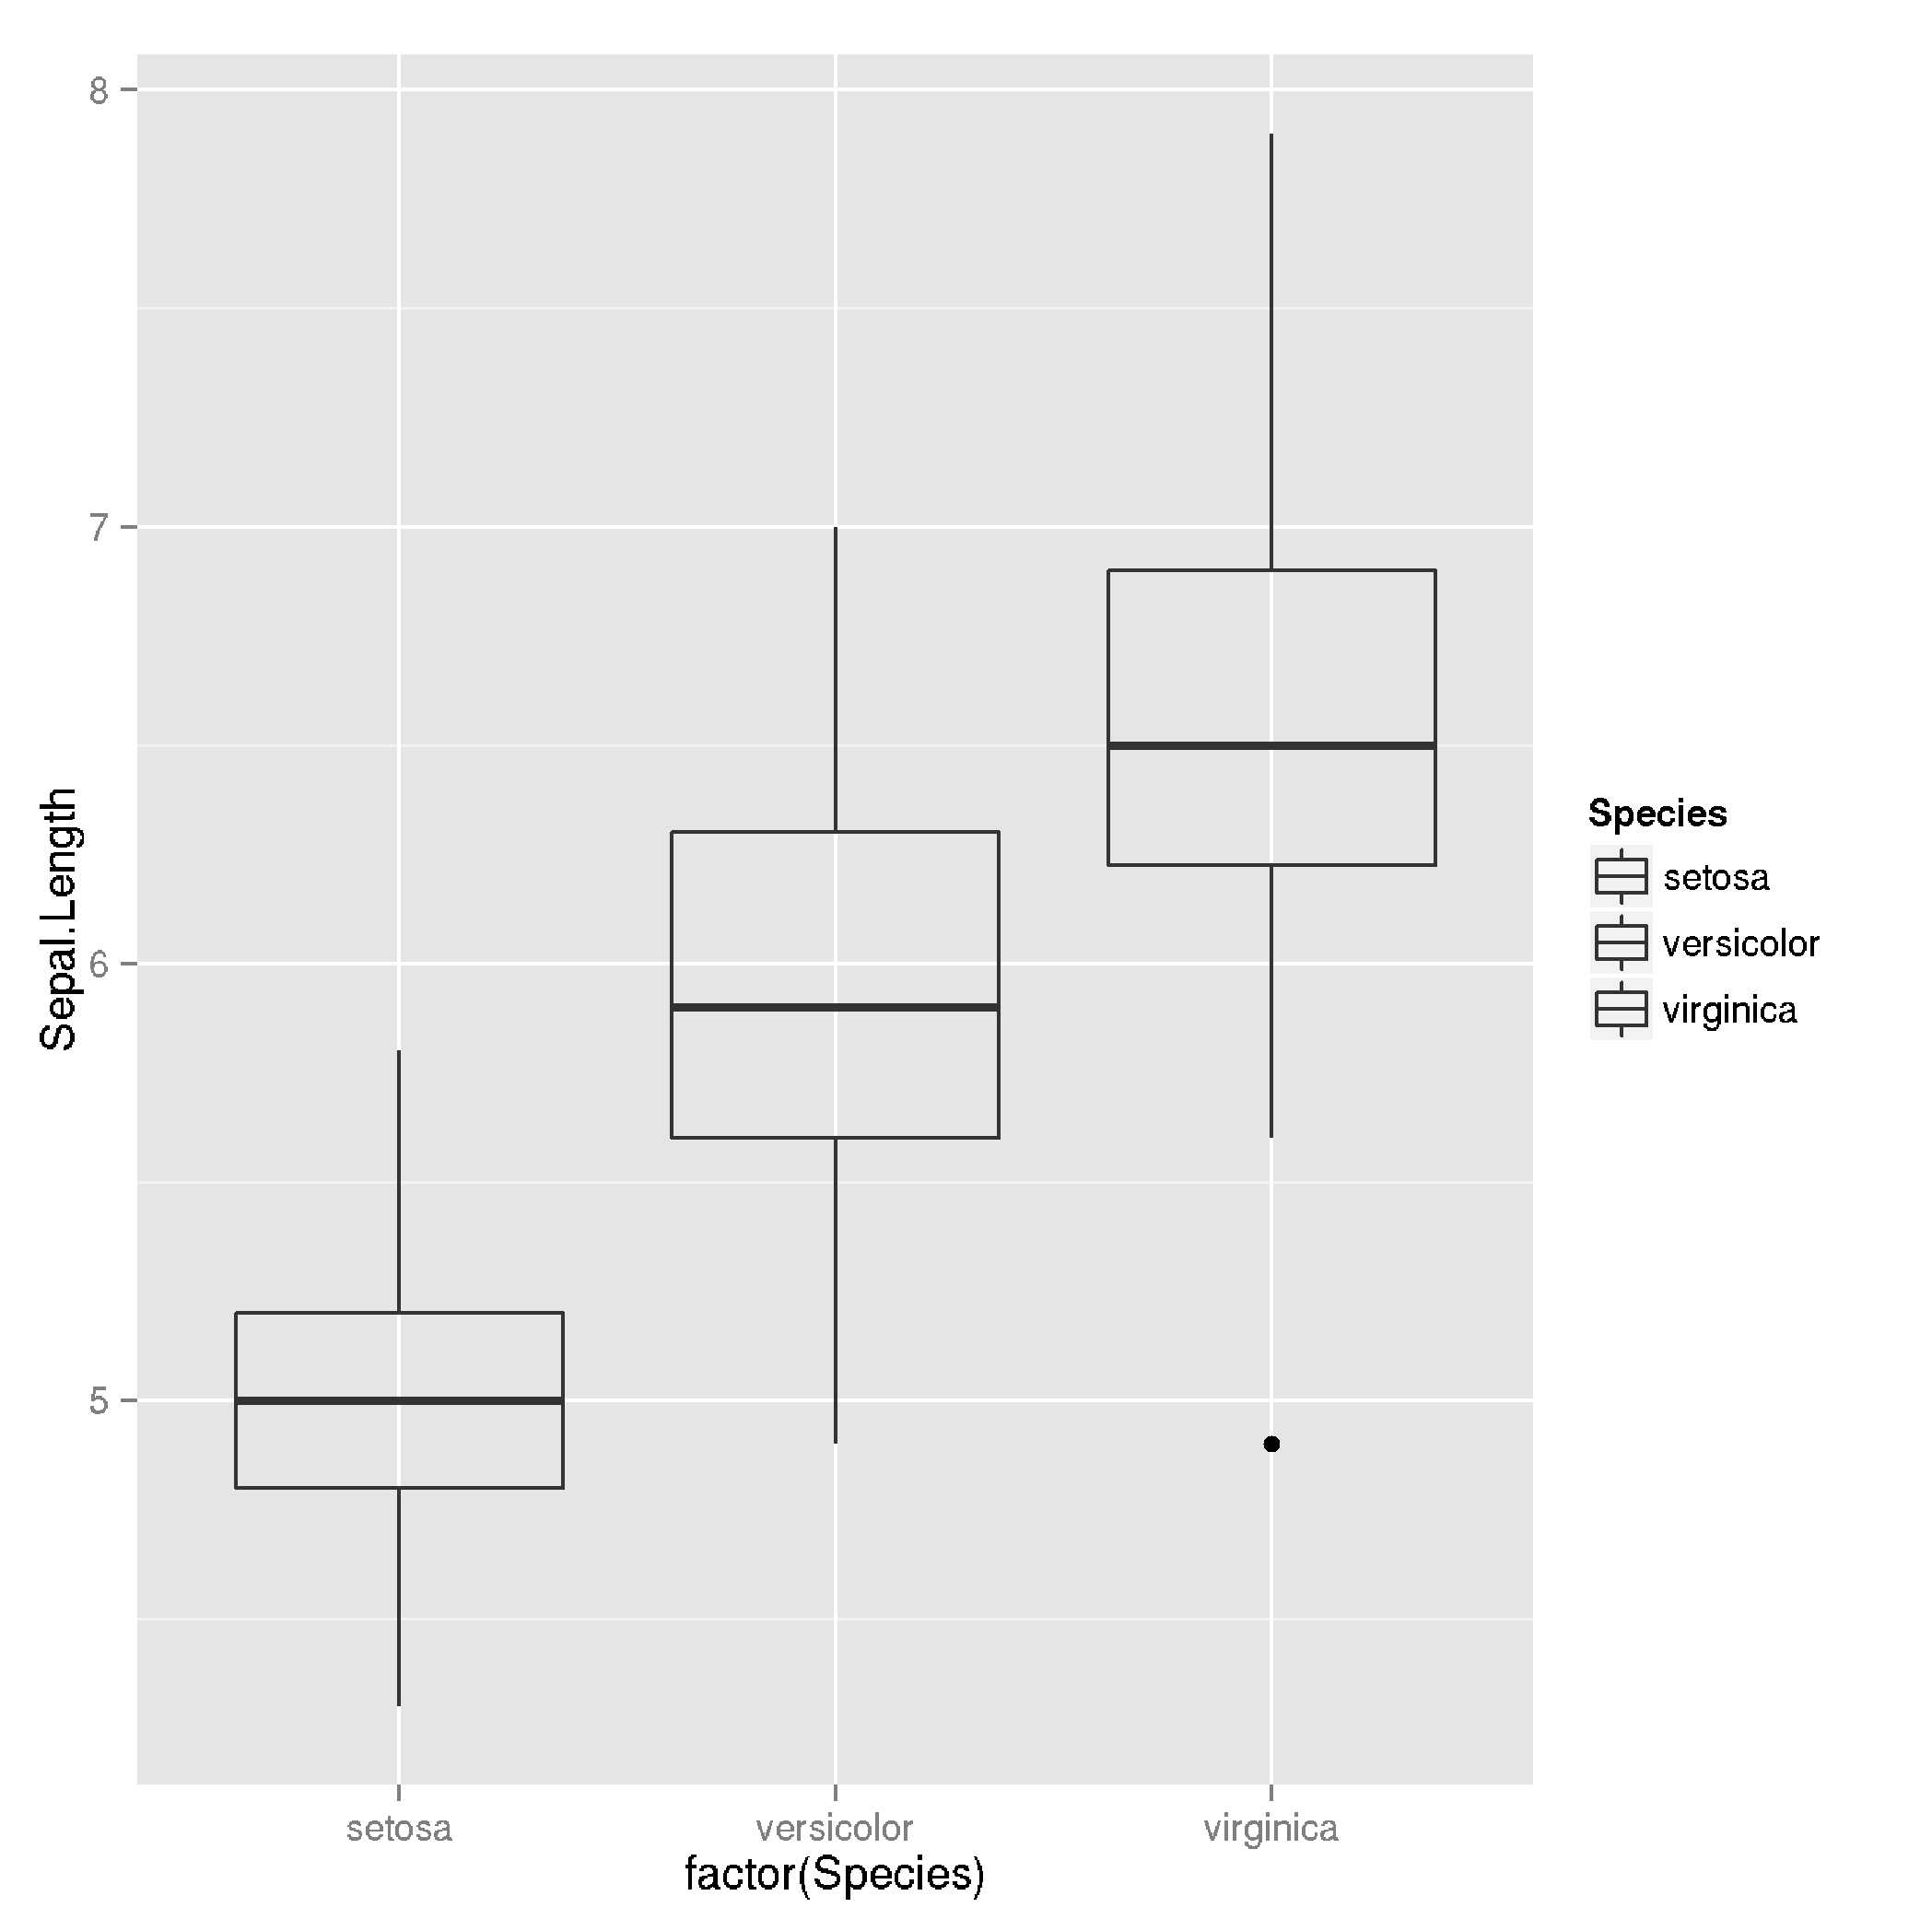
With the following error message:
Warning message:
In grid.Call.graphics(L_polygon, x$x, x$y, index) :
  semi-transparency is not supported on this device: reported only once per page
The issue has to do with the graphics device you are using. Specifically, the graphics device doesn’t support semi-transparency. There have been several threads on this issue already:
- How to set cairo as default backend for x11() in R?
- Semi-transparency in RStudio
- how do i preserve transparency in ggplot2
I was able to solve this issue by switching over to use the Cairo graphics device. Make sure you first install the Cairo R package.
install.packages("Cairo")
Once you have that installed, place the following in your ~/.Rprofile (code is from this thread).
setHook(packageEvent("grDevices", "onLoad"),
function(...) grDevices::X11.options(type='cairo'))
options(device='x11')
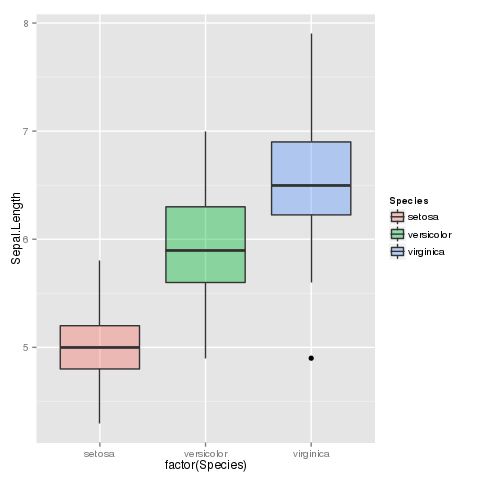
This makes it so that your default graphics device is set to Cairo whenever you start a new R session. Now open a new R session, and try the same plotting code (from above). You should see a plot with transparency now like this:
If you want to save this plot, you will need to use a Cairo-based graphics device:
ggsave("semi-transparency-r.png", device = CairoPNG)